
| Measure | Delivered figure | Planning use |
|---|---|---|
| Global capture capacity | More than 40 MtCO2 each year | Treat CCS as an operating industry that is still small in scale. Do not assume spare capacity will be available to you. |
| Sites in operation vs in development | 77 operating; 700+ in development worldwide (Global CCS Institute, 2025) | Most listed projects have not yet delivered. Build schedule margin into any plan that depends on one. |
| Sleipner, Norway | Commissioned in 1996; more than 20 MtCO2 stored in a deep saline formation about 1 km under the North Sea | The longest operating record for saline storage. Use it as the benchmark when judging newer storage proposals. |
| Viking CCS, UK | Initial storage capacity of around 4 MtCO2 per year | Shows the scale of one shared storage network. Check whether a nearby emitter cluster could use it. |
| HyNet North West and East Coast Cluster, UK | Transport and storage networks have reached financial close, with three associated emitter projects under construction | Financial close moves a network from plan to build. Emitters in these regions can weigh connection against developing their own storage. |
These figures come from the IEA’s CCUS overview and the CCS Association’s CCUS in action page, which cites Global CCS Institute 2025 data.
Carbon capture and storage projects deliver real but modest volumes today: facilities worldwide can capture more than 40 MtCO2 each year, while most planned projects remain in development.
Companies deciding whether CCS belongs in a decarbonisation plan will find the wider context in our guide to environmental technology for business. The sections below start with what the delivered record means for decisions, then cover the operating projects and the mechanism behind them.
What the delivered record means for decisions
The delivered record shows a technology that works but is far smaller than its pipeline of announced projects. That gap should shape how you plan around it.
- Separate announcements from operations. The CCS Association, citing Global CCS Institute 2025 data, counts 77 sites in operation against 700+ in development. A project on a developer’s list is not yet storing CO2. If your plan depends on third-party capture, transport or storage capacity, treat start dates as targets and keep a fallback.
- Quote capacity totals as a range, with source and date. The IEA puts worldwide capture capacity at more than 40 MtCO2 each year. Statista reported operational capacity of around 64 Mtpa as of July 24, 2025. The two figures differ by source and date, so state which one you are using rather than picking the larger.
- Look for shared infrastructure. The UK networks that reached financial close carry emitter projects under construction. An emitter near a shared transport and storage network faces a different decision from one that would have to find and develop its own storage site.
- Match the technology to the emitter. The IEA describes CCUS as capturing CO2 from large point sources, including power generation or industrial facilities using fossil fuels or biomass. Large stationary emitters are the natural fit. Diffuse emissions are a different problem, and the IEA points to direct air capture for those.
- Ask for cost as a quoted, project-specific figure. Delivered capacity is public, but cost depends on the capture, transport and storage arrangement of each project. Ask developers for a quoted cost per tonne covering all three stages rather than relying on a generic benchmark.
With those cautions in place, the individual projects show what has actually been built.
Operating projects and what they have delivered
Operating CCS projects span a long history, from early oil-recovery supply to offshore saline storage and new shared networks. Judging them by delivered tonnes rather than announced ambitions gives a more reliable picture.
Sleipner, Norway
The IEA says Sleipner was commissioned at an offshore gas facility in Norway in 1996. The project has now stored more than 20 MtCO2 in a deep saline formation about 1 km under the North Sea. It is the clearest evidence in this field that sustained injection into a saline formation can run for a long period. It is also a useful yardstick: a storage proposal that cannot point to a comparable operating record deserves closer scrutiny.
United States and Brazil
The IEA notes that some US facilities have operated since the 1970s and 1980s, and that the Val Verde area of Texas supplied CO2 for enhanced oil recovery. Statista’s July 2025 data show the United States has the most operational CCS facilities. It also lists the Petrobras Santos Basin pre-salt oil field project in Brazil with a capture and storage capacity of 14.2 Mtpa CO2.
Many of the best-documented projects therefore sit in oil and gas settings. A buyer of CCS services or credits should check whether the CO2 is stored in a geological formation or used for oil recovery, because those are different outcomes.
United Kingdom networks
The UK shows the shared-network model. The CCS Association reports that the HyNet North West and East Coast Cluster transport and storage networks have reached financial close. Three associated emitter projects are also under construction. It also gives Viking CCS an initial storage capacity of around 4 MtCO2 per year. These networks are at the build stage, so they are not yet part of the operating record, but they show where new capacity is heading.
How capture, transport and storage work
A CCS project is a chain of three stages, and the chain is only as strong as its weakest link. A capture unit with no transport route or storage site delivers nothing.
Capture
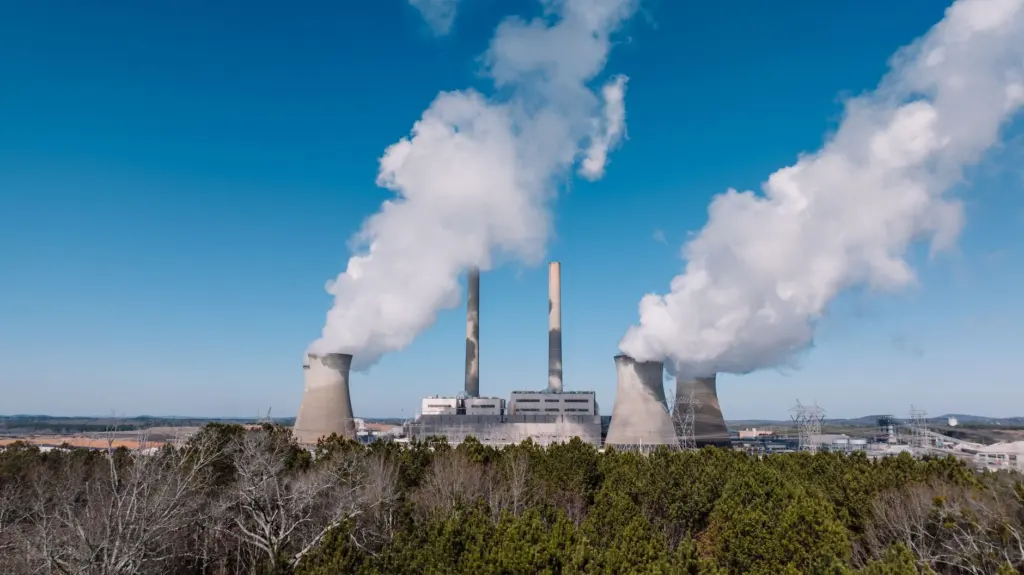
The IEA describes CCUS as the capture of CO2 from large point sources such as power generation or industrial facilities. The facilities burn fossil fuels or biomass. Capture happens at the facility itself, which is why large, steady emitters are the usual starting point.
Transport
If the captured CO2 is not used on-site, the IEA says it is compressed and moved by pipeline, ship, rail or truck. A project that uses its CO2 where it is captured can skip this stage entirely. For everyone else, the transport mode and distance are design choices that sit between the capture plant and the storage site, and they should be settled early.
Storage
At the storage stage, CO2 is injected into deep geological formations, which the IEA says trap it for permanent storage. Depleted oil and gas reservoirs and saline formations both qualify. Sleipner’s saline formation, about 1 km below the North Sea, is one working example.
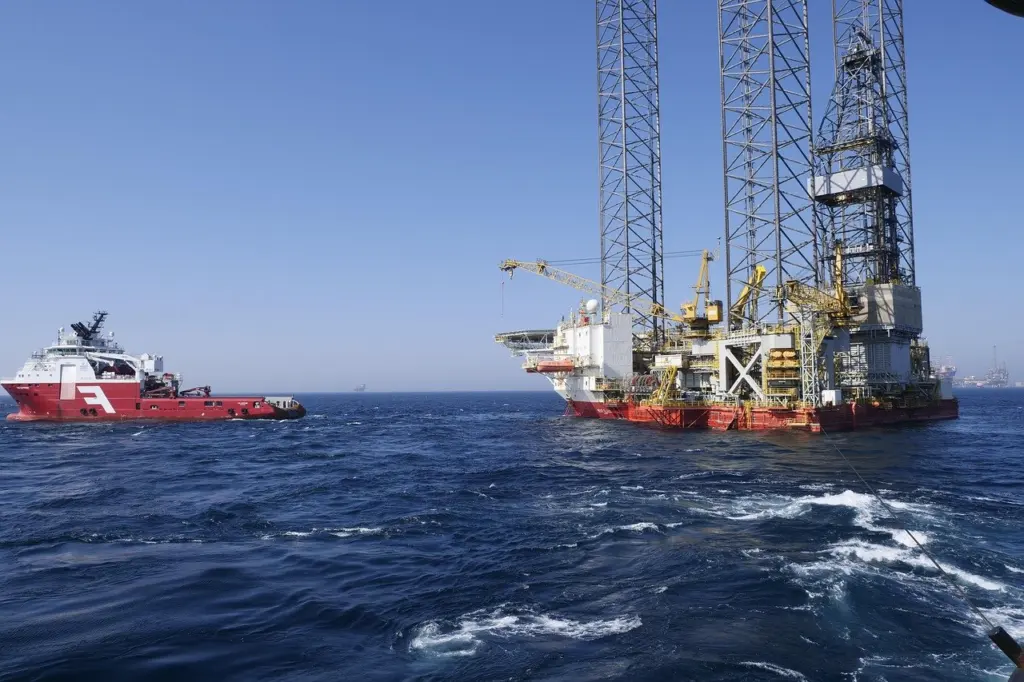
Because storage is geological, site choice matters as much as the capture technology. The formation type, depth and location relative to the emitter decide whether a project is practical at all.
Direct air capture and where it fits
Direct air capture takes CO2 straight from the atmosphere, whereas point-source capture takes it from a facility’s own emissions. The IEA’s CCUS overview includes this route alongside capture at large emitters. In practice the two answer different needs. A power or industrial site with its own CO2 stream is a point-source case, while DAC is relevant when the aim is to remove CO2 from ambient air.
The operating record described above comes from capture at oil, gas and industrial facilities. Assess DAC separately, on its own delivered numbers, instead of borrowing the track record of those projects. CCS is also one lever among several for industry. Fuel-side options such as hydrogen are covered in What Is Green Hydrogen? A Practical Guide To Clean Fuel In 2026 – Greencrowding.
Frequently asked questions
How is direct air capture different from capturing CO2 at a factory or power plant?
Point-source capture takes CO2 from large sources such as power generation or industrial facilities. Direct air capture takes CO2 directly from the atmosphere, according to the IEA.
Which country has the most operating CCS facilities?
The United States, according to Statista’s July 2025 data on operational CCS facilities.
Is CO2 always stored underground after capture?
No. The IEA says captured CO2 can be used on-site rather than transported. Early US projects supplied CO2 for enhanced oil recovery. Permanent storage specifically means injection into depleted oil and gas reservoirs or saline formations.